A plea to all seismic interpreters
This is the zone where clinform topsets transition into foresets. Multiple sand-on-sand contacts as distributary channels incise into delta front sand-bodies.
I could continue with these stories but the point here isn’t to demean anyone. If you wouldn’t drop a few hundred dollars on a new camera or cell phone without background research, why would you drill a multi-million dollar well in a reservoir where you have no sense of geometry or dimensions?
Here are some tips you can use to get better acquainted with your reservoir:
1. Use Google Earth – So you’ve computed some very fancy seismic attribute with a cool sounding name. Compare your horizon slice with modern satellite imagery. Those lineaments may be fractures or beach ridges on a strandplain. Let’s take a look at some strand plains and not just the one in Nayarit but everywhere. Use the measuring tool, how does the scale compare with what you have? Google Earth is free!
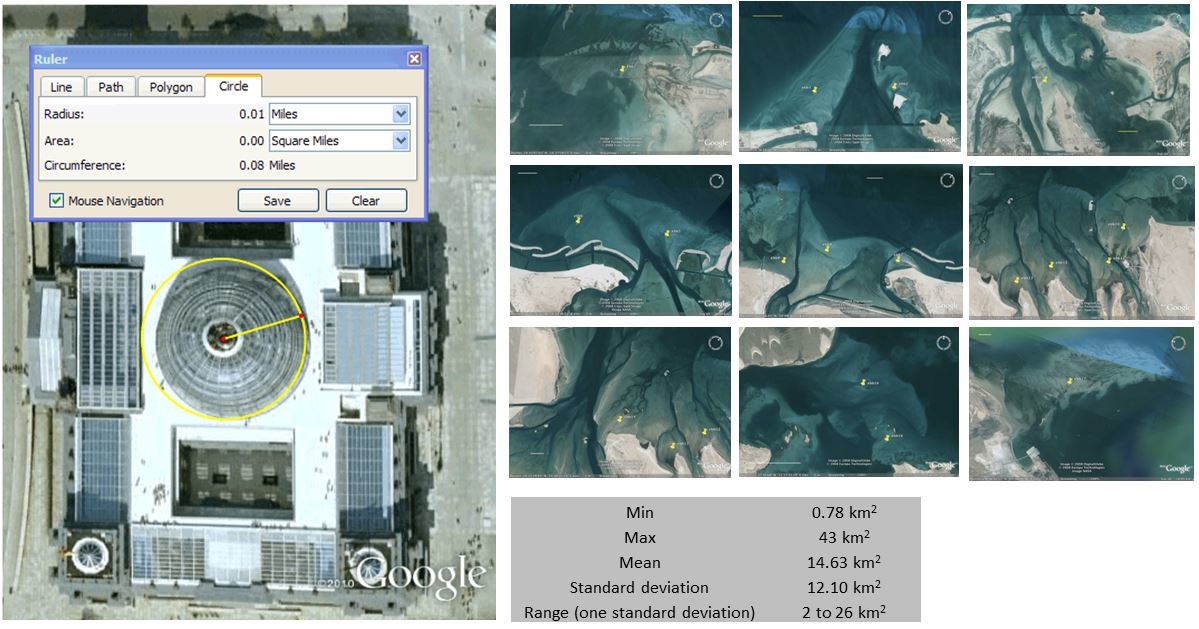
An example from the modern Persian Gulf where flood tidal deltas were measured using Google Earth
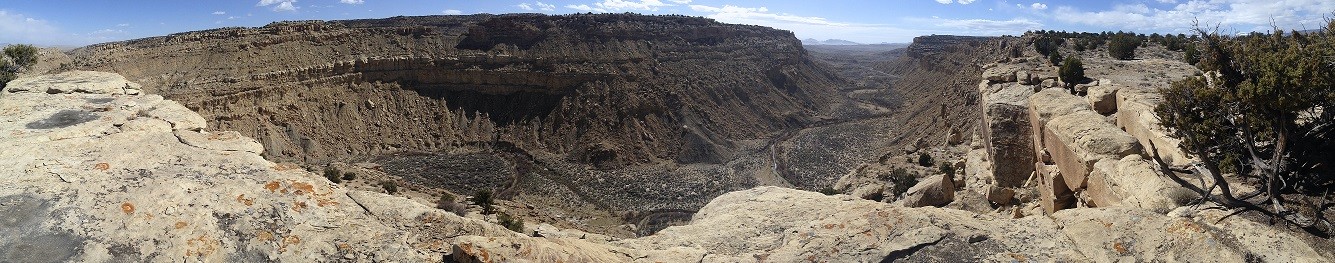
2. Take a geology field trip – you will learn more in a day on the outcrop with a good instructor than a year of interpretation on your workstation. One of the things we do on our trips is take participants to “seismic-scale” outcrops and have them trace sand-bodies on a panoramic photo and then discuss seismic facies.
3. If you read number 2 and thought “this guy’s crazy, my manager won’t even let me attend a local conference let alone a geology field trip!” no worries, go out on your own. Most oil towns are located by the sea. Pull out a map and look for the closest delta or estuary. Go check it out. How wide is the estuary? And how thin is the inlet? Pull up a bathymetry map. The NOAA offers these for free, and you can also look up local maps issued by fish and wildlife divisions. Now you can tell how deep that tidal or distributary channel may be and then decide whether that feature on your seismic data is a channel or something else (in my seismic stratigraphy courses I have had seasoned interpreters call synclines channels).
4. Pull out a copy of Walker’s Facies Models. How thick are the reservoir facies? What’s the resolution of your data? If you’re going to chase a “detached shoreface” at a depth of 3000 meters, figure out what these are, how thin they are and whether it’s even realistic to image these in your data.
What I don’t recommend is working in a bubble. Eight hours of interpretation punctuated by meetings for thirty plus years without “seeing” your reservoir, whether in outcrop or in a modern setting is a recipe for disaster.

Post a comment
You must be logged in to post a comment.