How To Describe and Interpret Carbonate Thin-Sections
Recently a friend of mine (a graduate student at Miami’s Carbonate Research Laboratory) asked for my workflow for the description and interpretation of carbonate thin-sections. I figured if someone at the world’s best carbonate school is curious about this, others may be too which is the motivation for this post.Before I go on I do want to clarify that this is MY methodology, there may be others that you may even find “better” than this one. So I encourage you to explore what’s out there.
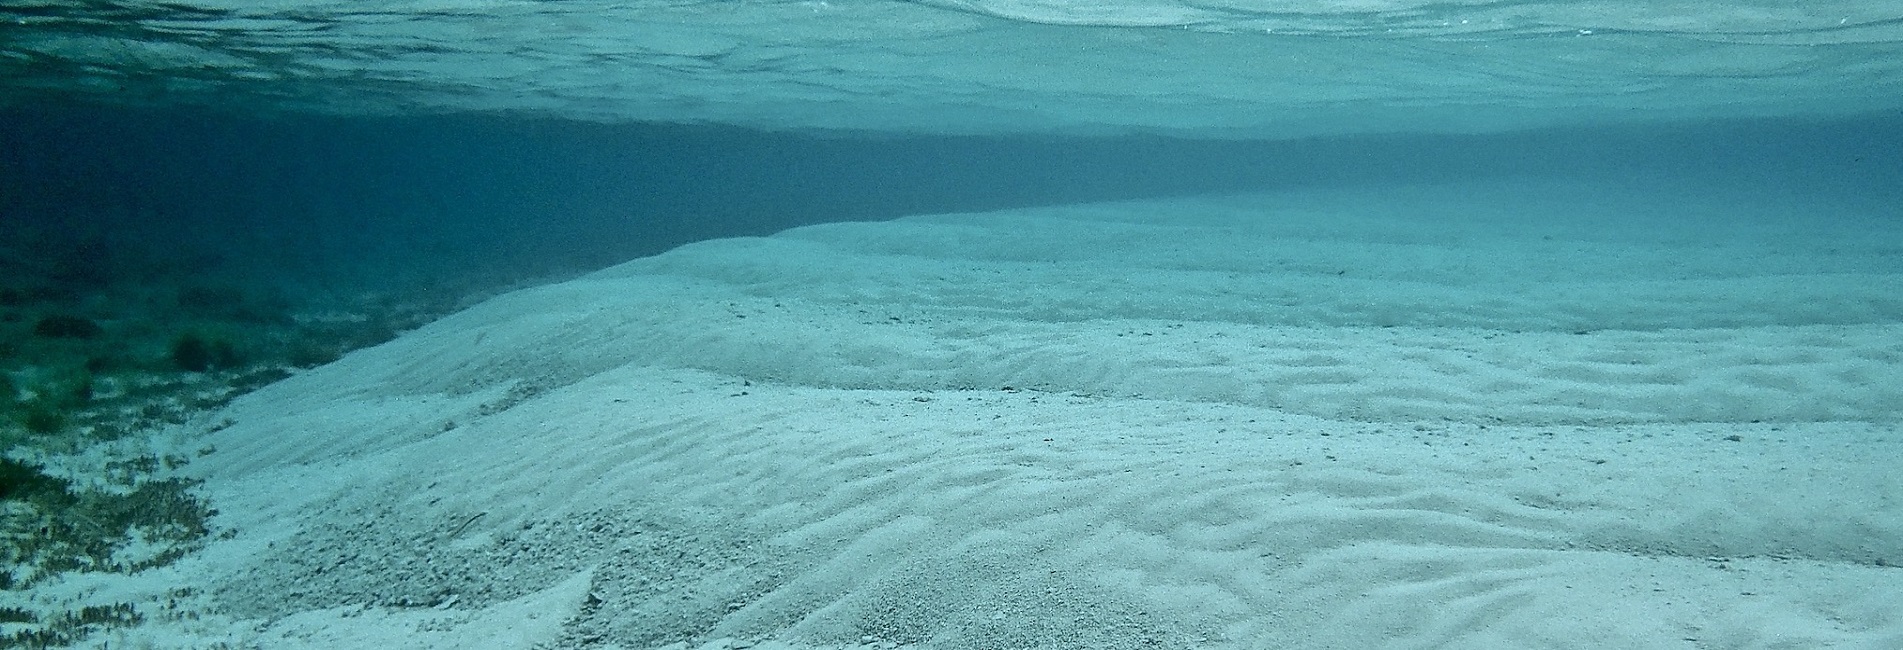
Step 1. Scan your thin-section
You can do so either using a commercial slide scanner or a cheap film scanner. Commercial scanners start at around $2000 and go up to $10,000 or so. Film scanners, of course aren’t as high quality but start around $100. Regular paper scanners won’t do the job. The purpose of scanning is to get an overview. Jump directly to the microscope and often you will miss subtle details in bedding and textures.
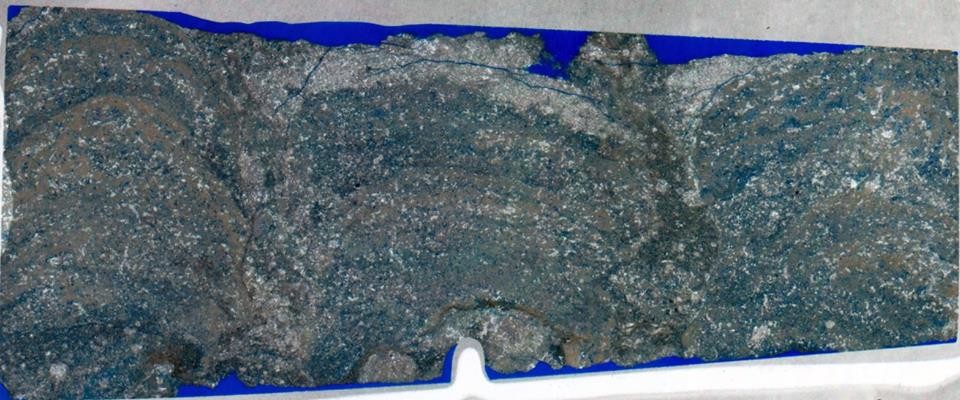
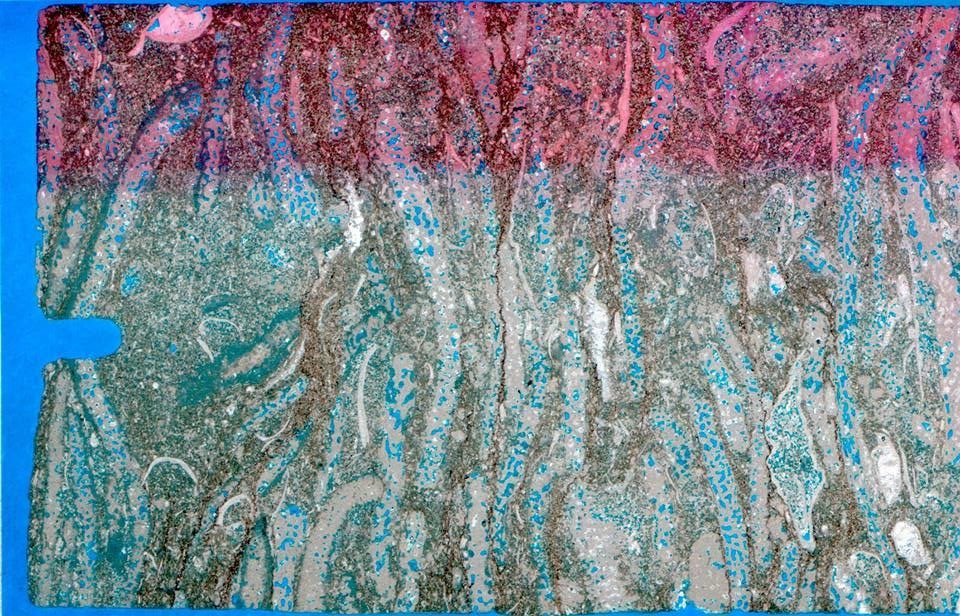
Thin-section scan allows you to see individual heads within this microbialite
Step 2. Start with low magnification and measure percent grains-cement and matrix
Most carbonate rocks will have varying percentages of matrix, cement and grains. I usually use the 2.5X magnification to quantify these. Of course you will have examples where there is no cement, or perhaps its all matrix but no grains and cement, documenting percentages will be important when naming your sample. This is also where I try to identify the matrix type but with higher magnification (micrite, microspar and calcisiltite). If you don’t know how to identify matrix types I would recommend going through Erik Flugel’s Microfacies of Carbonate Rocks.
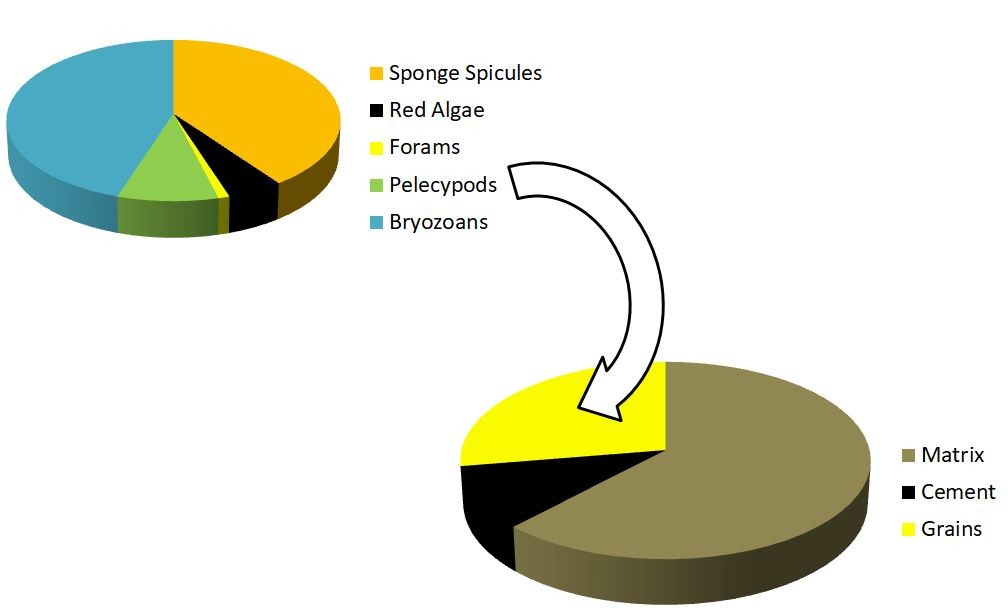
Graphic representation of the sample and then percentages of individual grain types
Step 3. Grains
I like to keep things simple and split grains into skeletal and non-skeletal for starters and record their percentages within the sample. You can use any thin-section percentage chart such as the one shown here. Now begins the tricky part. You need to identify as many skeletal and non-skeletal grains as you can and then document their percentages. Learning how to identify carbonate grains takes lots and lots of practice. An excellent resource is the AAPG color guide by Peter and Dana Scholle. If you noticed we’re measuring a lot of percentages so I usually set-up an excel file and enter values while I measure. When setting up the excel file make columns for every grain type present in your sample. Lets assume the first sample only has peloids and nothing more. Then you will have just one column. If your next sample has peloids and intraclasts, you can create an extra column for intraclasts and so on. Doing this in excel also helps create pie charts which in my opinion are a great way of comparing one microfacies with another.
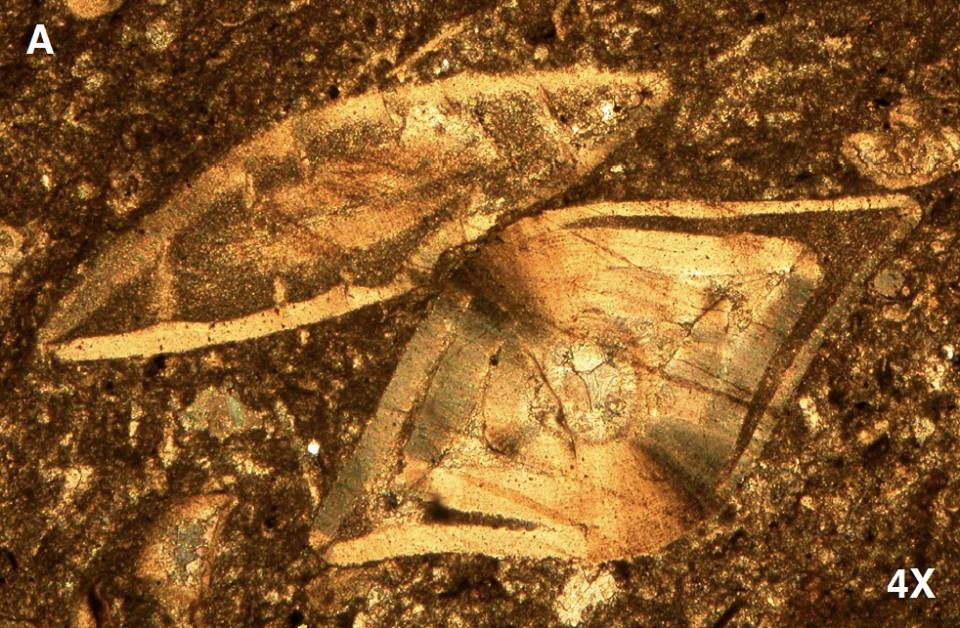
Benthic foraminifera such as these can be excellent indicators of paleo-water depth
Step 4. Bioturbation, cements, compaction, and fracturing
The role of burrowing in carbonates can be complicated. In certain cases it increases permeability and in other cases it doesn’t. Either way their presence must be noted. Cements need to be identified because these will help reconstruct the succession of diagenetic events (paragenesis). Again the Scholle book is fantastic and another great resource is the lectures by Chris Kendall on the SEPM website. After cements have been identified you need to look for all evidence for compaction. This includes but is not limited to squished grains (e.g oval ooids), sutured contacts, and crushed/deformed grains. Finally its important to document fracture type, density, and cross-cutting relationships if multiple sets are present.
Porosity associated with burrowing – make sure you document boring as well!
Step 5. Pore types
Unlike sandstones where intergranular pores are the dominant (if not the only) pore type, carbonate pores are highly diverse. There are several classification schemes out there but my own preference is by Arve Lonoy. This entails describing porosity type, their distribution as uniform or patchy, measuring pore size and finally creating pore fabrics. By doing so you can use a critical flow parameter to calculate net:gross.
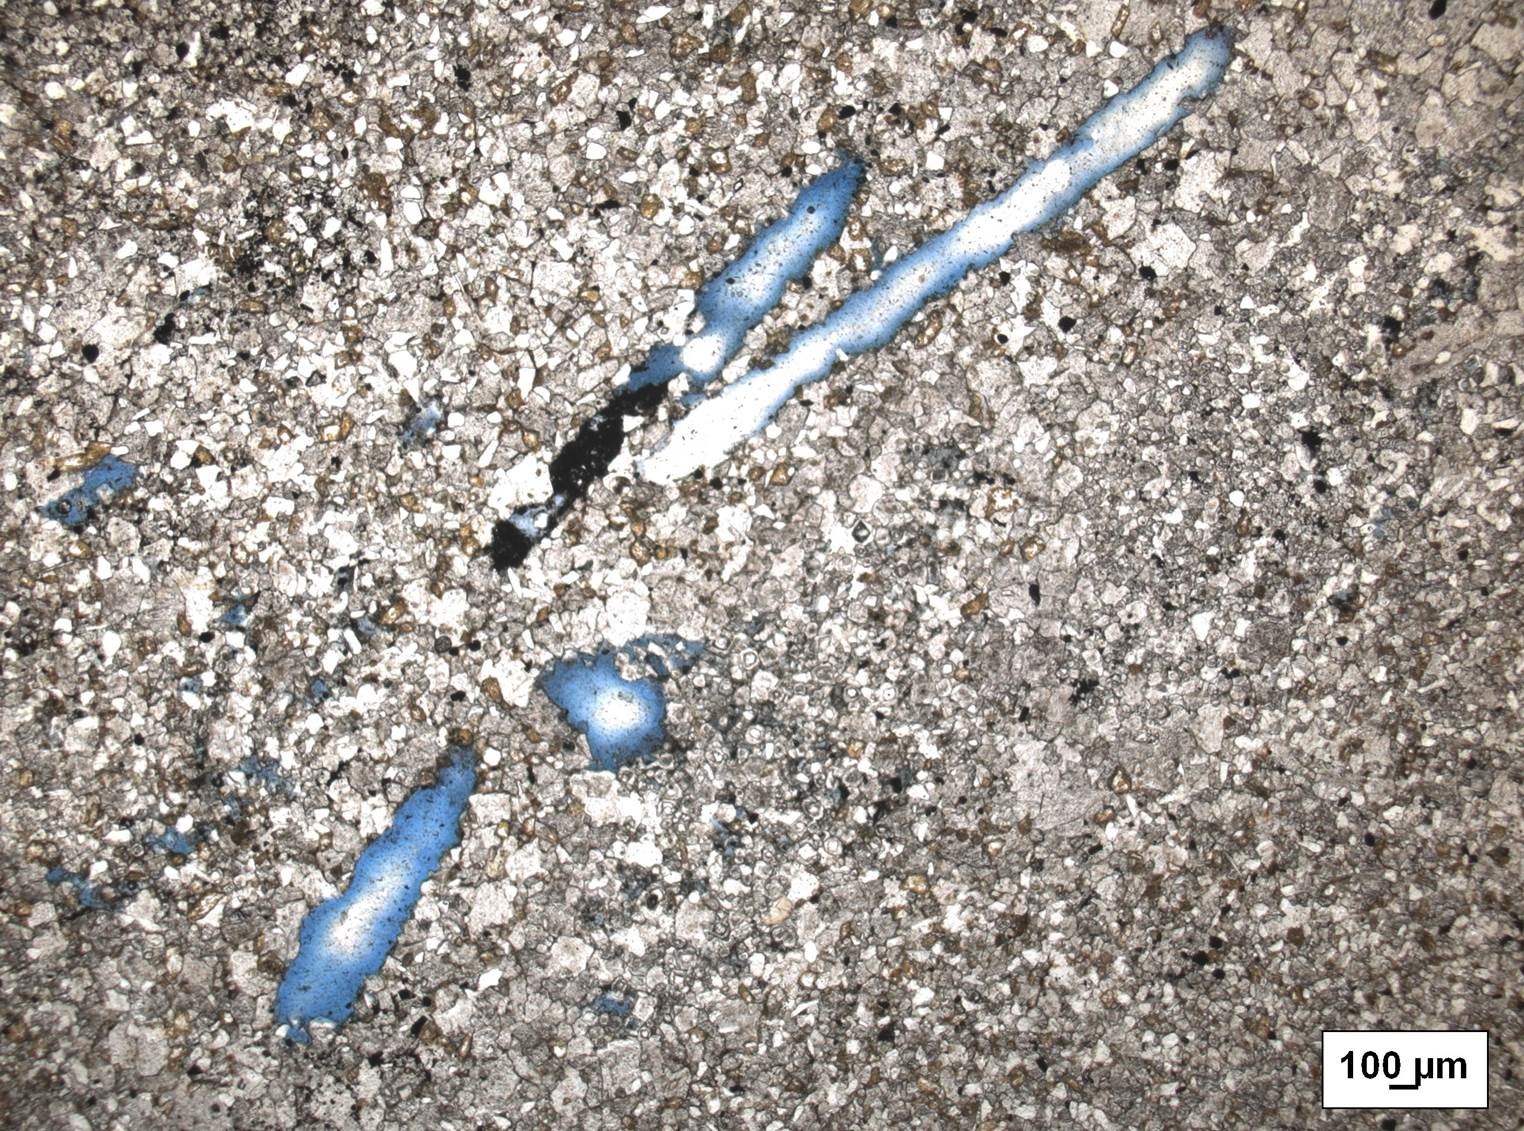
Intraclastic porosity within blades of Phylloid Algae – carbonate pores are diverse and one sample can contain several types, each type must be quantified
Interpretation
Matrix wont tell you much but its percentage relative to grains and cements will. Grains are your friend (some being friendlier than others). For example benthic foraminifera can give you details of paleobathymetry, whereas peleycpods (bivalves) tend to be ubiquitous. Assemblages of skeletal grains matter and can help you determine whether the paleocommunity was light-dependent (Chlorozoan) or not (Heterozoan). Non-skeletal grains are helpful in most cases and some are highly diagnostic of a particular environment of deposition. The occurrence of pisoids for example has been tied to a specific facies belt in the Permian Basin. Like skeletal grains your focus shouldn’t be on the presence of that one odd-ball but the association of grain types.
Every cement type belongs in its respective diagenetic environment. Always begin with looking for evidence for synsedimentary cements first. Then look for burial cements and separate the vadose cements from those in the phreatic, then for evidence of deep burial and eventually exhumation. All this is easier said than done! If your job is to interpret environments of deposition, then I wouldn’t mess with trying to figure out diagenetic events unless you are trained to do so. Unfortunately reading books wont train you to tackle carbonate diagenesis. This is an art best learned under the tutelage of an experienced mentor. Fortunately there are short courses on diagenesis so I would recommend you enroll in a few before diving into this world on your own.
Keep your business goals in mind when interpreting. If the goal is to create a sequence stratigraphic network then look for defining characteristics of subaerial exposure and hardgrounds. If the goal is to look at microfractures only then no need to spend hours documenting percentages of dasyclads vs red algae.
Go have fun! and upload some cool photomicrographs on linked-in!

Post a comment
You must be logged in to post a comment.