How to describe and interpret clastic core
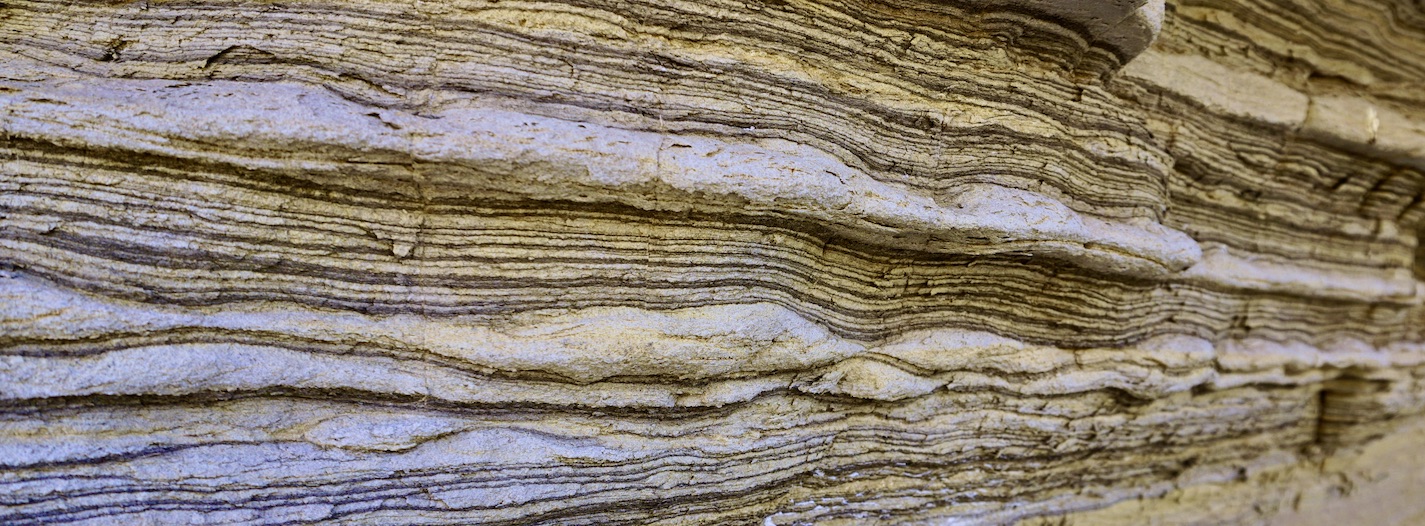
Tidal processes dominated deposition of this cat-back dune in the Cretaceous Frewens Sandstone of the Powder River Basin, USA
2. Process
For every sedimentary structure ask yourself: what hydrodynamic conditions would be needed to form this feature in this particular grain-size and in this order of events?
The fun doesn’t stop once deposition has ceased. In the marine realm (and often on land as well) this is when critters of all kinds will churn the sediment, to dwell, to seek food and sometimes to escape the unwelcome sand or mud dumped on them. This is the complicated world of ichnology and I am no expert. Fortunately, I have had the honor of learning from some of the best, and if you’re serious about describing core I suggest you do too.
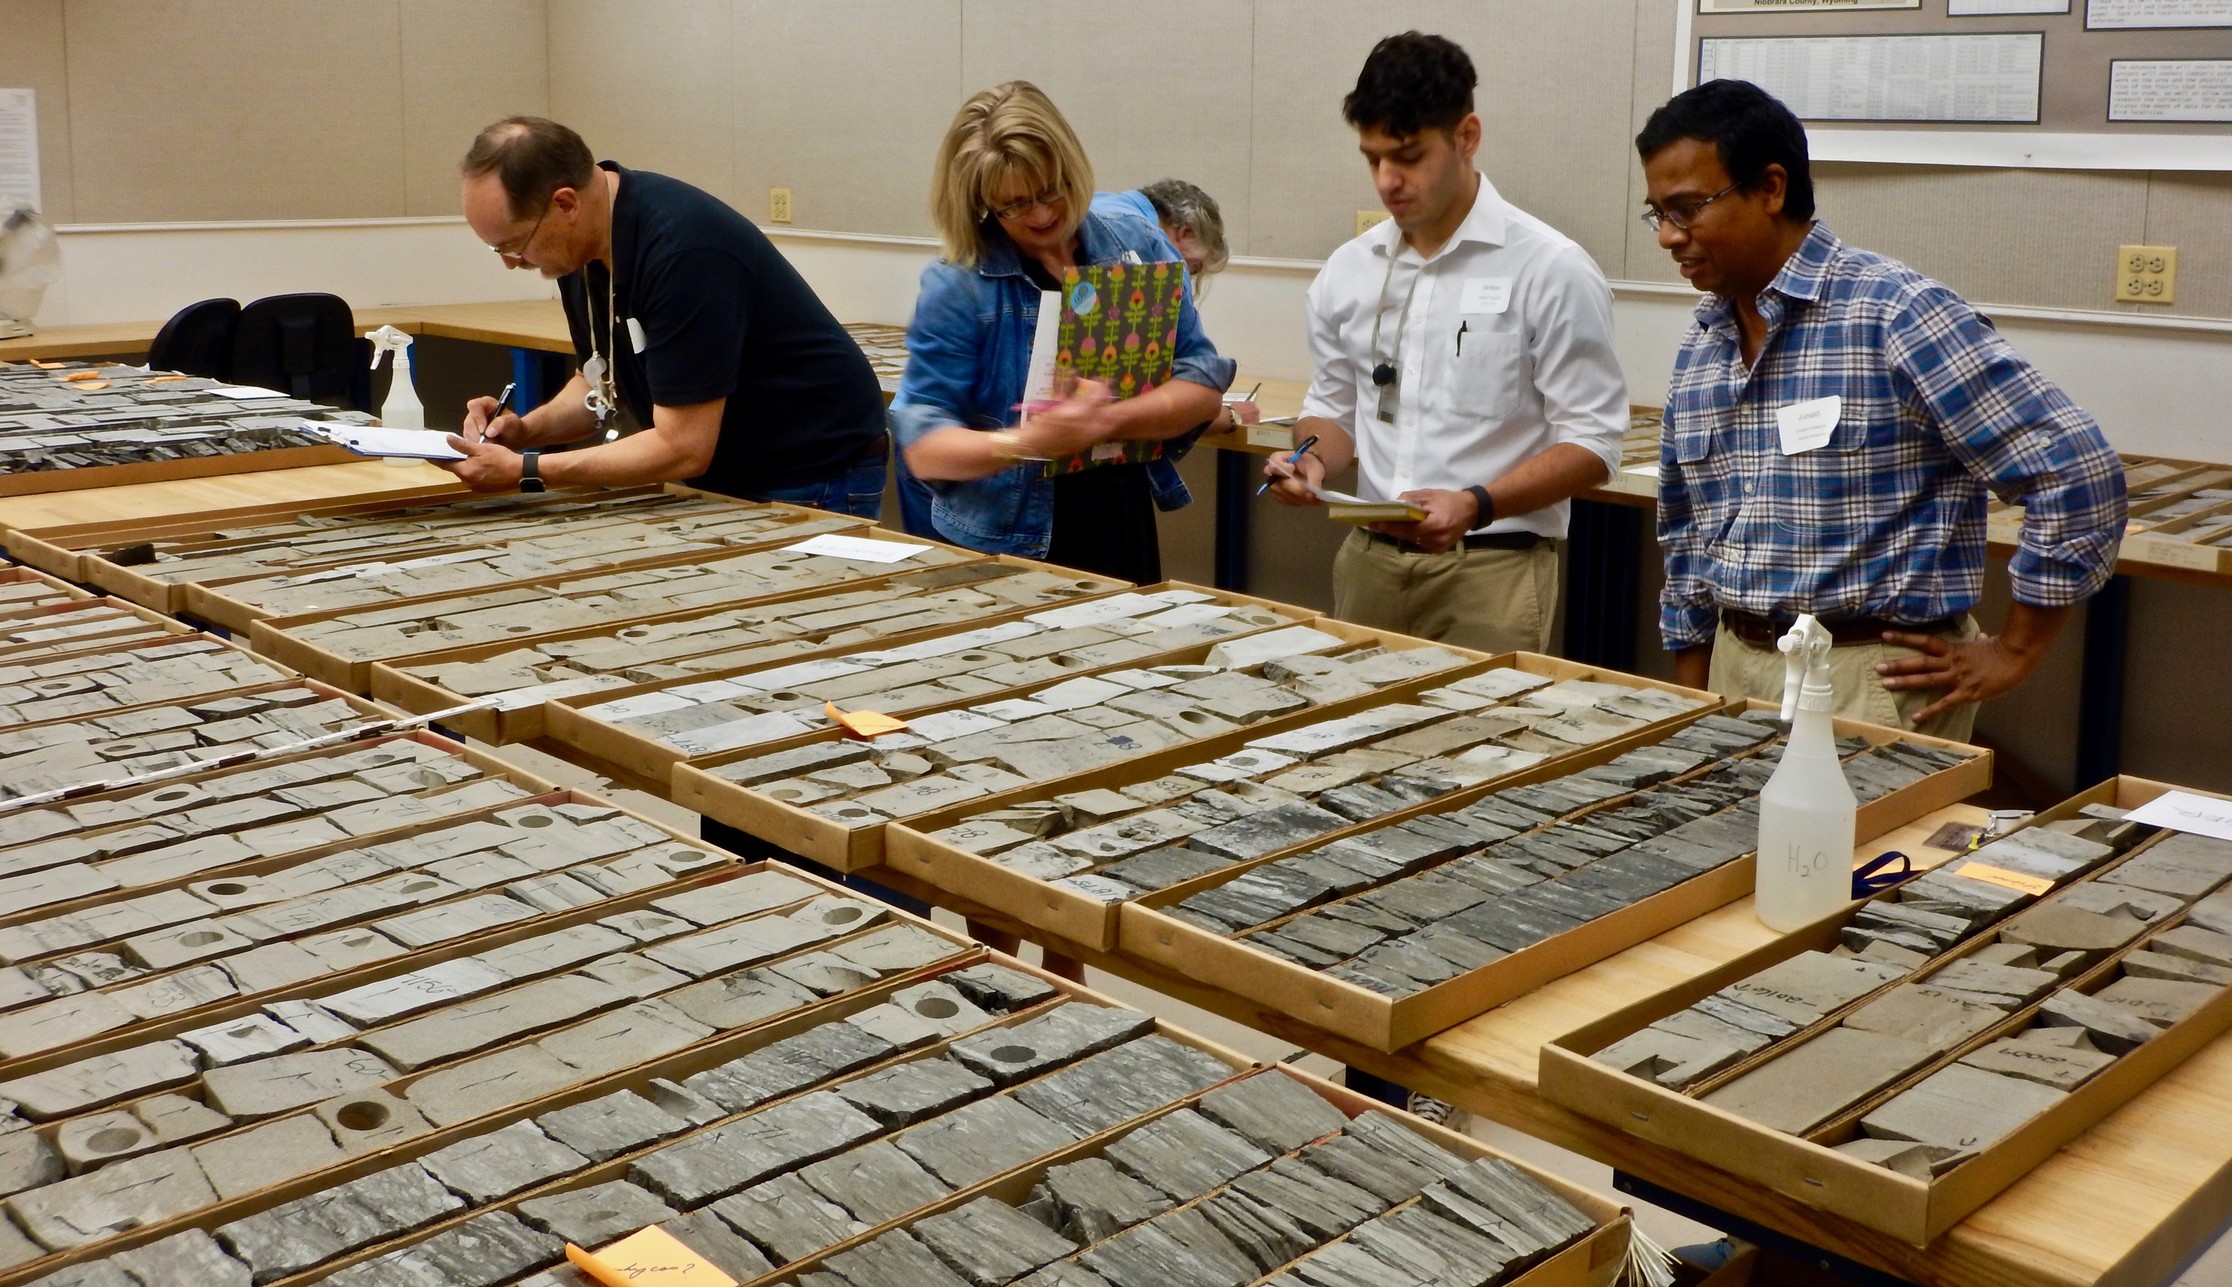
Our ichnology maestro Dr. Sadeque showing how its done during a workshop on the Muddy “J Sandstone”
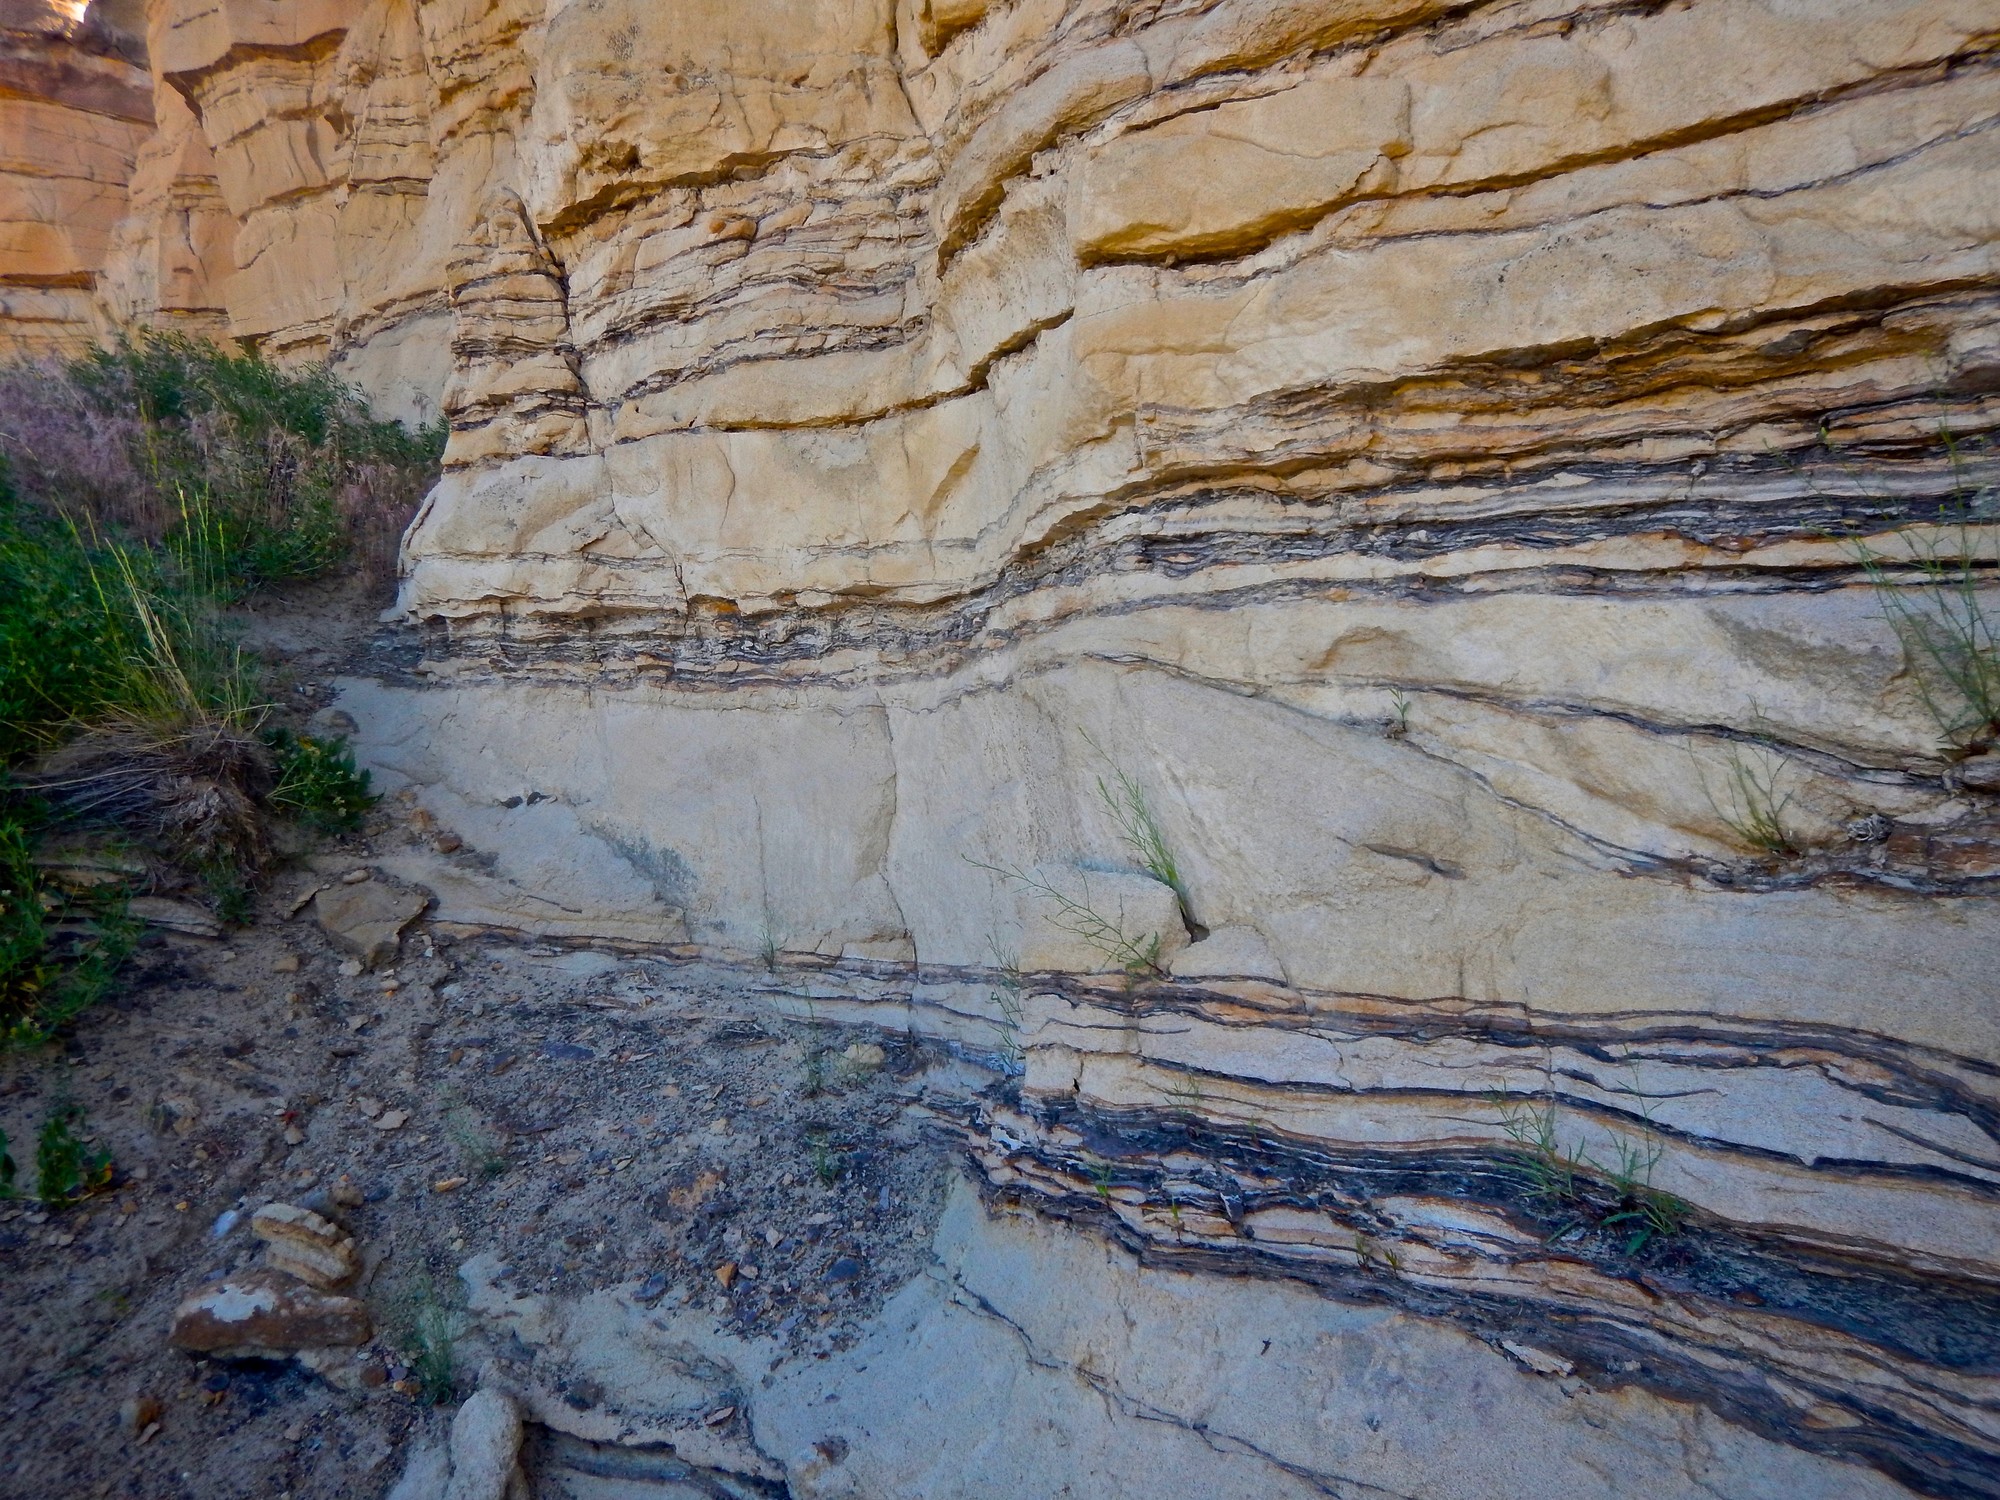
3. Context
To me context comprises of all supporting evidence that may prove or disprove an interpretation. This could be facies associations in core, log signatures and even seismic data.
In simple terms, just because you see vertical burrows in “clean” sandstone doesn’t mean it’s a beach deposit. Every piece of the puzzle needs to come together. In certain cases core just isn’t enough. For example it’s ridiculously difficult to distinguish tide-dominated deltas from estuaries from core alone. You need clear demonstration of progradation to differentiate one from the other. This often comes from integrating logs or seismic data.
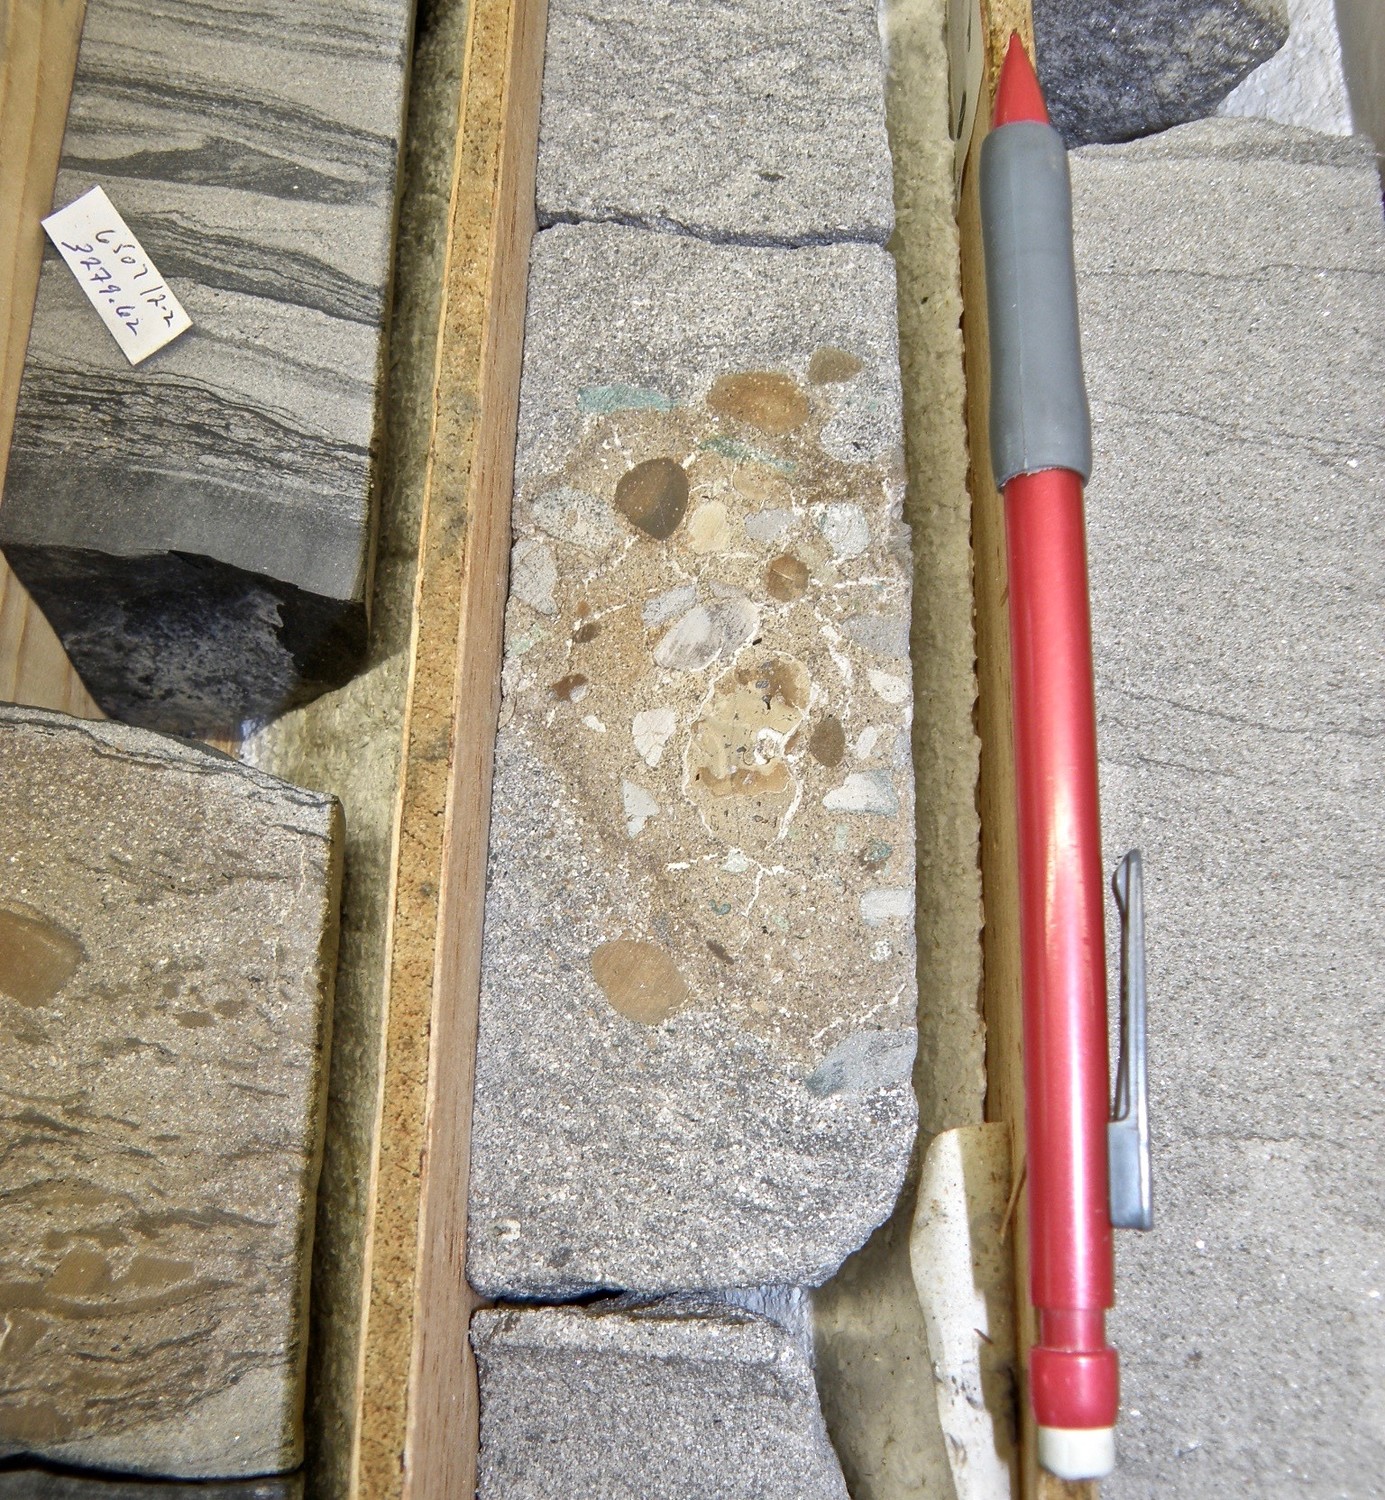
Armored mud-ball from the deepwater sandstones of the Cretaceous Lysing Formation, Offshore Mid-Norway
4. Interpretation
This for me is the most fun part because after working hard towards an interpretation I like to play devil’s advocate and see how many ways I can shoot my own model down. This is science, not religion and you can’t hold on to your beliefs. You’re going to be wrong often, so instead of waiting for someone else in a different company looking at your data to come up with an alternate interpretation, why not go through the exercise yourself?
As a consultant I will often provide my clients with multiple cross-sections using the same set of core data, with the stipulation that one is more likely than the other, and acquiring additional data will reveal which of the two is more feasible.
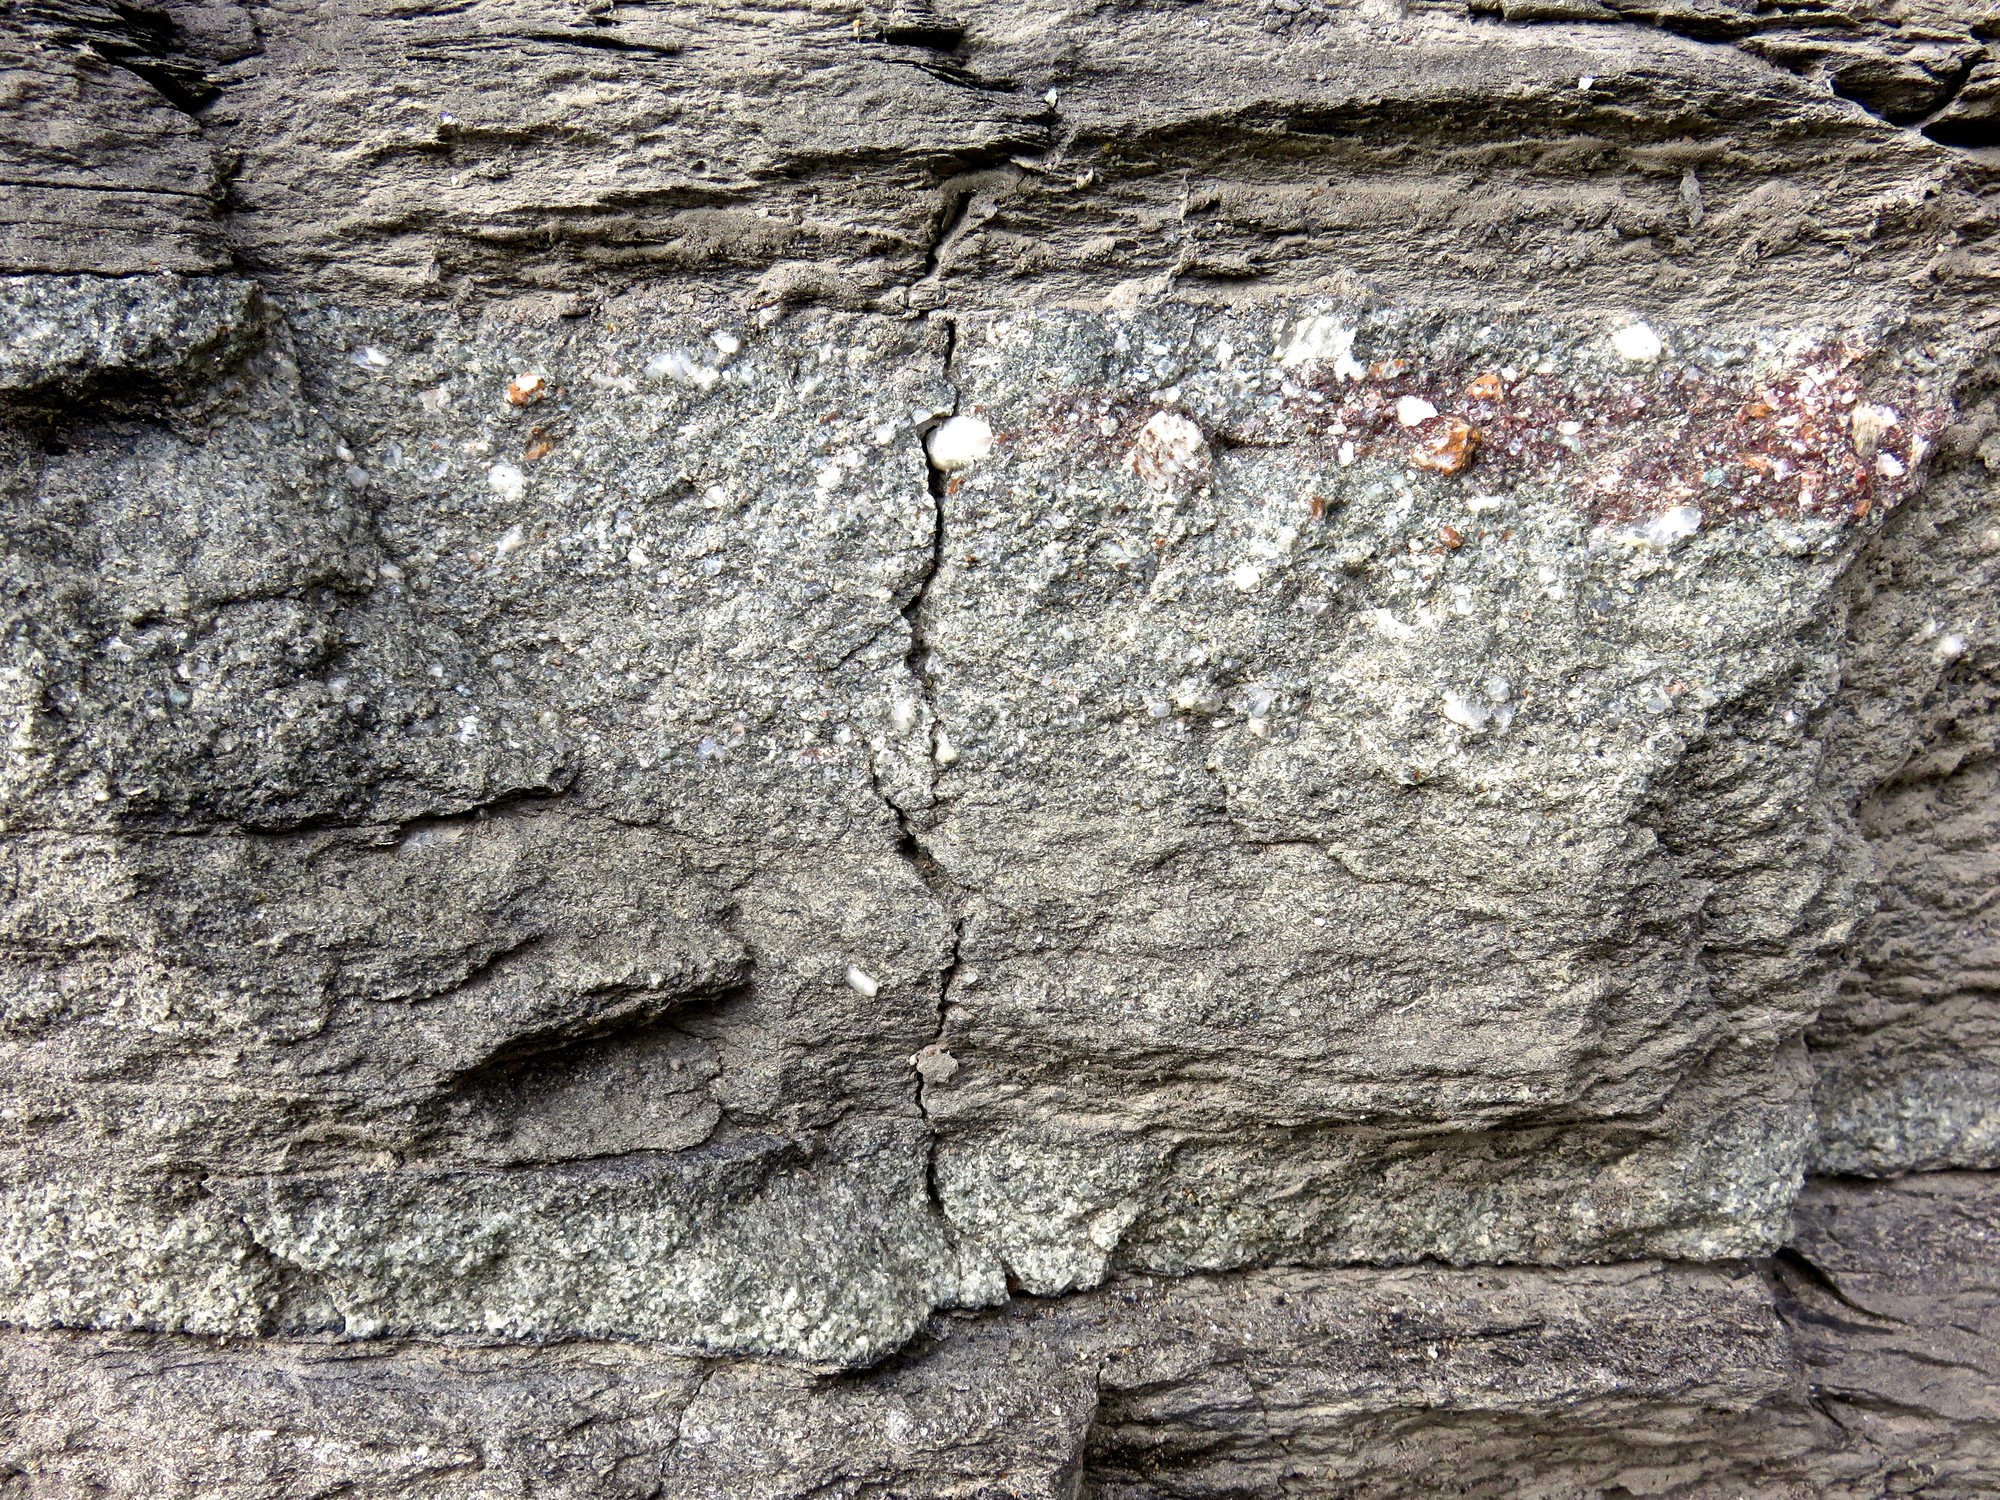
Coarse-grained inversely graded debrite analogs for the Granite Wash of the Anadarko Basin
To conclude remember that your core description is not going to end up as a poster on your wall. This is a product others will use for decades perhaps. Make it user-friendly. If you’re working for a fancy consulting firm that loves adding a million curves for isotopes etc, ask yourself, can the average asset team geologist even use these data? Provide what’s useful and avoid the bells and whistles. Software packages can make your life easier but will the final user of your product be able to orient themselves to their core using your graphic representation?
Now go have fun and put some pictures on linked-in. If you would like a step-by-step methodology for describing core, check out knowledgette.

Post a comment
You must be logged in to post a comment.